Progress and Performance
In line with the HKUST 2020 Sustainability Challenge, HKUST has been proactive in the implementation of new initiatives and campus metrics analysis to better understand campus sustainability trends, performance, and areas of need.
Energy
Around 95% of total energy consumption comes from electricity. The consumption of electricity is an indicator of how we are doing with regards to air pollution and greenhouse gas emissions. In the 2018-19 academic year, HKUST consumed nearly 90 million kWh of electricity, which was a decrease of 3% compare to 2017-18 levels. During the year, Facilities Management Office paid great efforts in leading energy saving projects such as installing virtual stack fans, lighting retrofitting for common area, installing of variable speed drives for condensing water pumps at central chiller plant and recommissioning of BMS system for Enterprise Center. As can be seen in the graph, significant decrease was achieved in energy consumption in 2018 and 2019. This is largely due to the energy reduction strategies in different facilities.
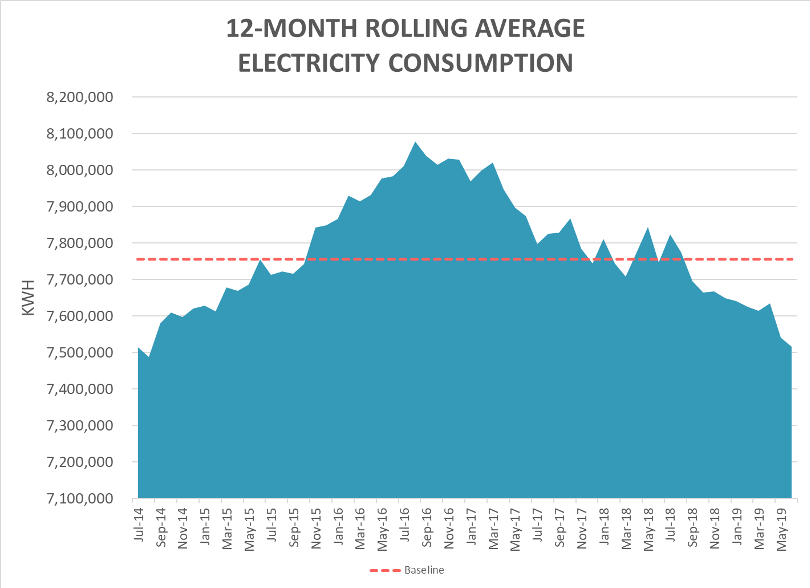
Trial Charts for 2018-19 Annual Report (tab’Chart_12Electrcity’)
Electricity Consumption 2018-19
TOTAL = 90,186,094 KWH
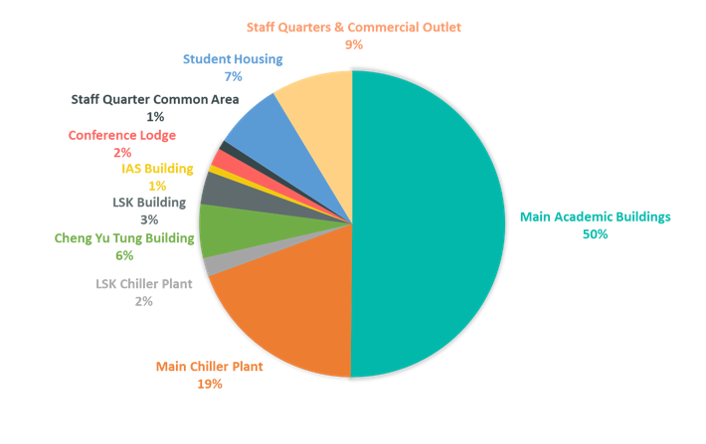
Trial Charts for 2018-19 Annual Report (tab’ Chart_Electricity’)
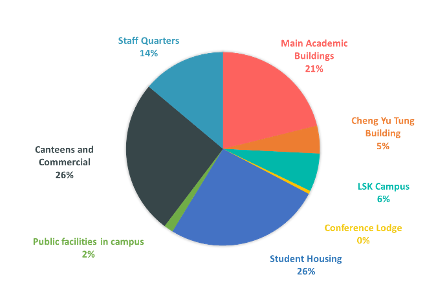
Energy reductions are a top priority of the Sustainable Operations Executive Committee (OpCo), which oversees different on-going initiatives and aggressive energy reduction projects. The main academic buildings and main chiller plan were the major drivers of energy consumption, representing 69% out of the total. While electricity is the largest category of energy consumption, Towngas – a combination of natural gas and naphtha – accounts for 460,000 units (roughly equal to 6.13 million kWh). Towngas is a non-renewable source of energy and does contribute to the carbon footprint. There is no space heating provided in the main academic building, but Towngas is used for cooking in the canteens and domestic hot water in residence halls and staff quarters. The remainder of the energy consumption (0.2% of the campus total) comes from liquid fuels for standby generators (stationery diesel) and transportation vehicles such as diesel and unleaded petrol.
Towngas Consumption 2018-2019
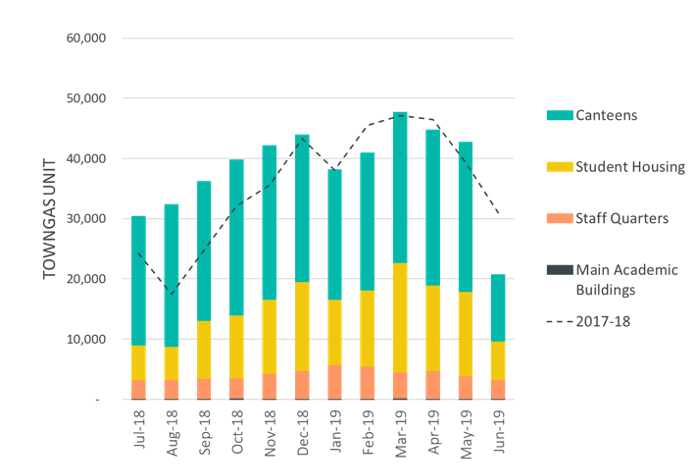
Trial Charts for 2018-19 Annual Report (tab’ Chart_Towngas’)
Greenhouse Gases
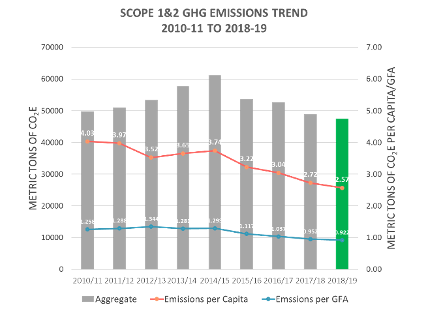
In the 2018-19 academic year, HKUST emitted 47,500 metric tons of CO2 equivalent (MTCO2e) from sources of Scope 1 and 2, which is 2.7% lower than last year. Scope 1 Direct GHG emissions increased by 6.9% this year due to the renovation of G/F & LG1 canteen during 2017-18; while Scope 2 Energy indirect GHG emissions shows a 3% reduction. Because of the high plug load and cooling load demand, Scope 2 emissions from purchased electricity are dominant, which account for around 96% of reported GHG emissions. The intensity of emissions per capita and per square meter of building area have decreased over three straight academic years.
Scope 1 & 2 GHG Emissions Trend
2010-11 to 2018-19
Trial Charts for 2018-19 Annual Report (tab’ Chart_Towngas’)
Definitions
Scope 1 emissions refer to those generated on site. Examples are gasoline for vehicles, towngas for cooking, and leaked refrigerants from air conditioning.
Scope 2 emissions refer to those generated by off-site power plants. While the university is responsible for using electricity, it has no control over the conditions in the plant.
Scope 3 emissions refer to emissions emitted by someone else, but are influenced by university actions. Examples are employee commuting and university-sponsored air travel.
Water
Water resources at HKUST come from two main sources: potable water, which is clean and drinkable, comes from the Hong Kong Water Supplies Department and is used for cooking, cleaning, showers, and drinking. Our toilets, on the other hand, use seawater from the Clear Water Bay. Using seawater for toilets helps conserve the precious fresh water we need for all other uses.
Total water consumption reached 396,000 cubic meters, (m3), or 396 million liters, which is equivalent to 158 Olympic sized swimming pools. The water consumption per person was 21.4 m3, which is a 3.6% reduction compared to last year.
Water Consumption 2018-19
TOTAL = 395,899 CUBIC METER
Trial Charts for 2018-19 Annual Report (tab’ Chart_Water’)
Trial Charts for 2018-19 Annual Report (tab’ Chart_Water (2)’)
Waste
The HKUST 2020 Sustainability Challenge set a reduction target of 50% below the baseline year of 2014. The strategy for reaching that target focuses on four key areas, namely recycling, food waste, compostables, and reductions at source (i.e., preventing waste from entering the campus in the first place). Now we have more than 10 types of materials for recycling ranging from common paper, plastic containers, metal to polyfoam, animal bedding and landscape. We hope to divert as much waste as possible from landfill through this aggressive recycling program.
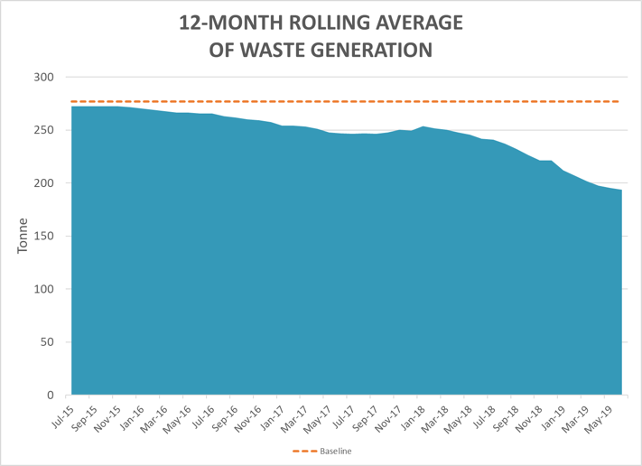
12 month rolling average of waste generation
Trial Charts for 2018-19 Annual Report (tab’ Chart_Waste (3)’)
Compostables recycling program has been implemented for around 1 year but we can already see satisfactory progress has been made. The food waste program, which already captured all of the kitchen and table scrap wastes from the canteens. Except canteens in the public area, food waste collection is also available in staff quarters and residence halls. The university also included an expanded polystyrene (EPS), Styrofoam collection program, which does not reduce the overall numbers (because polystyrene is so light) but does reduce the bulk of trash significantly. It also guarantees that the light foam will not end up in the ocean, which is particularly dangerous to wildlife and very difficult to clean up afterwards.
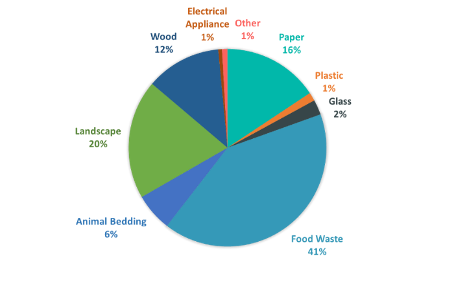
Recycling 2018-19
TOTAL = 746 TON
Trial Charts for 2018-19 Annual Report (tab’ Chart_Recycling’)
Total diverted from Landfill
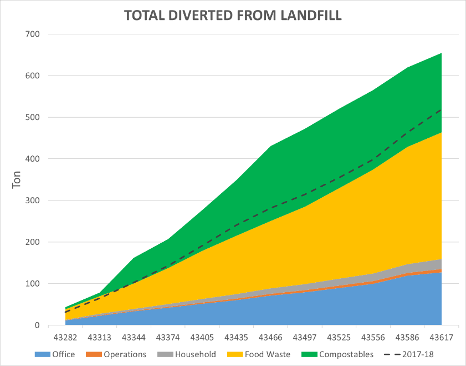
Trial Charts for 2018-19 Annual Report (tab’ Chart_Landfill’)
In the 2018-19 academic year, the waste to landfill dropped from 2,880 tons last year to 2,323 tons (19.3%), while the recycling amount increased by 31.5% with a total of 746 tons recyclables collected. The waste diversion rate was 24.3%.
With the expansion of food waste, the introduction of new streams like EPS, minor works construction wood and metal waste, yard waste, and household electronics, the total amount of recycling increased by 32%. After 1 year effort, landscape contribution was increased from 4% to almost 20%, which was the second highest recycled material. Food waste was the most commonly recycled material, representing 41% of total materials diverted from the landfill. Food waste generated was 16.5kg per capita, which was a 3.2% reduction compared to previous year. Paper was the third highest recycled material, contributing to 16% of the total recycling amount.
Reduction Target
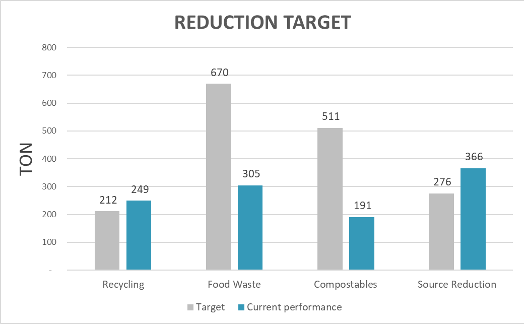
Trial Charts for 2018-19 Annual Report (tab’ Chart_Waste(2)’)
Printed Paper
The total amount of paper consumed was 34,040 reams. Compared to last year, the total amount of paper was 1,900 reams less, representing a 5.3% decrease. In other words, it helps saving 114 trees. Meanwhile, the total annual paper usage equated to 1.8 reams per person in 2018-19 or an 10% reduction per capita.
It is notable that the quantity of recycled paper used counted for 45% of total paper consumption. It was encouraging to see that more departments and offices switched to recycled paper; however, we will continue to work on minimizing the paper use for printing, and when paper is necessary, to use recycled content.
A4 paper consumption trend
2011-12 to 2018-19
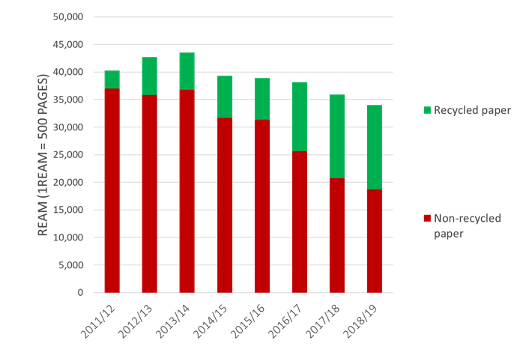
Trial Charts for 2018-19 Annual Report (tab’ Chart_Paper’)
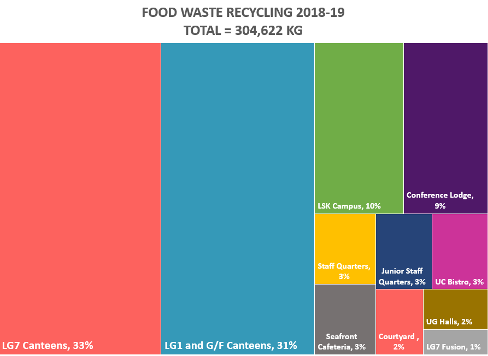
Food waste
According to our waste audit data, HKUST roughly generates 4 tons of food waste every day. To address this, the university has launched food waste collection and recycling program in September 2016 and began at canteens. Later then, the program has since grown to include Junior Staff Quarters and office pantries. During the 2018-19 academic year, we appointed an outside contractor to collect the food waste every day, together with the help of the canteens, students and staff, 304 tons food waste were diverted to animal feeds and compost.