Energy and ghg
HKUST is committed to becoming a net-zero carbon university by 2045, if not earlier, by taking the lead on developing solutions that demonstrate our dedication to creating a true net-zero world. This includes scope 1 and 2 emissions and embodied carbon of the new development. For our near-term target, our target is to achieve a 40% reduction in GHG emissions (Scope 1 and 2) by 2028, using 2014 as the baseline year, as part of the HKUST 2028 Sustainability Challenge. Another near-term target is to achieve 50% reduction from the baseline year by 2035. In summary, our reduction targets for Scope 1 and 2 GHG emissions are 40% by 2028, 50% by 2035 and to achieve net-zero by 2045.
The graph below maps out our current performance against these targets with a reduction of 32%, on track to our near term 2028 and 2035 targets.

Our reporting methodologies and emission factors follow the GHG Protocol Corporate Account and Reporting Standard, and the EPD Guidelines to Acccount for and Report on Greenhouse Gas Emissions and Removals for Buildings (Commercial, Residential or Institutional Purposes) in Hong Kong.
In the 2024-25 academic year, HKUST emitted 1,221 metric tons of CO2 equivalent (CO2e) from sources of scope 1, 40,22 metric tons of CO2e from scope 2, and 284 metric tons of CO2e from scope 3.
Compared to 2023-24 (the first academic year with a full resumption of in-person activities after the Covid-19 pandemic), scope 1 emission is 51% lower; scope 2 emission is 6% higher, and scope 3 emission is 33% lower. The increase in scope 2 emissions is mainly caused by an increase in energy usage.
Compared to the base year of 2014-15, this year’s scope 1 emission has decreased by 13% compared to baseline, while scope 2 and scope 3 have decreased by 33% and 64% respectively compared to the baseline year. The total scope 1 and 2 GHG emissions see an overall 32% reduction from the baseline year.

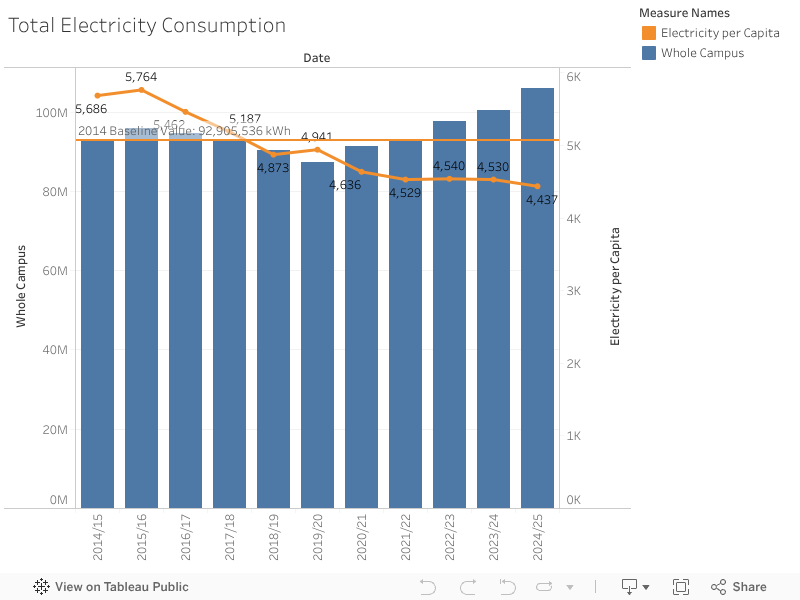
Around 95% of total energy consumption comes from electricity. The consumption of electricity is an indicator of how we are doing with regards to air pollution and greenhouse gas emissions. In the 2024-25 academic year, HKUST consumed approximately 111,091,123 million kWh of energy, which is an increase of 9% compared to 2023-24 levels, which is driven by an addition of a data center and higher temperatures caused by climate change and therefore more energy usage for cooling. Electricity used is 106 million kWh, which is roughly 95% of total energy usage. Over the past year, the projects contributing to energy savings which can be seen in 2023-24 ESG report here. HKUST also regularly conducts comprehensive energy audits to identify areas of highest energy waste. These audits have led to the projects contributing to energy savings, which can be seen in our ESG reports.
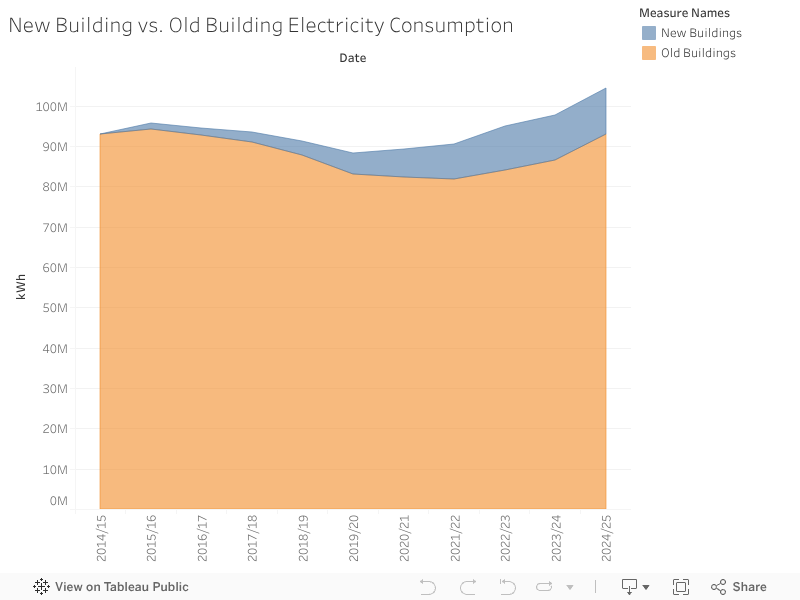
Compared to 2014, the campus has grown extensively by a 48% increase in the gross floor area. It is observed that without the new buildings since 2014, the electricity consumption has decreased by around 170,000 kWh.
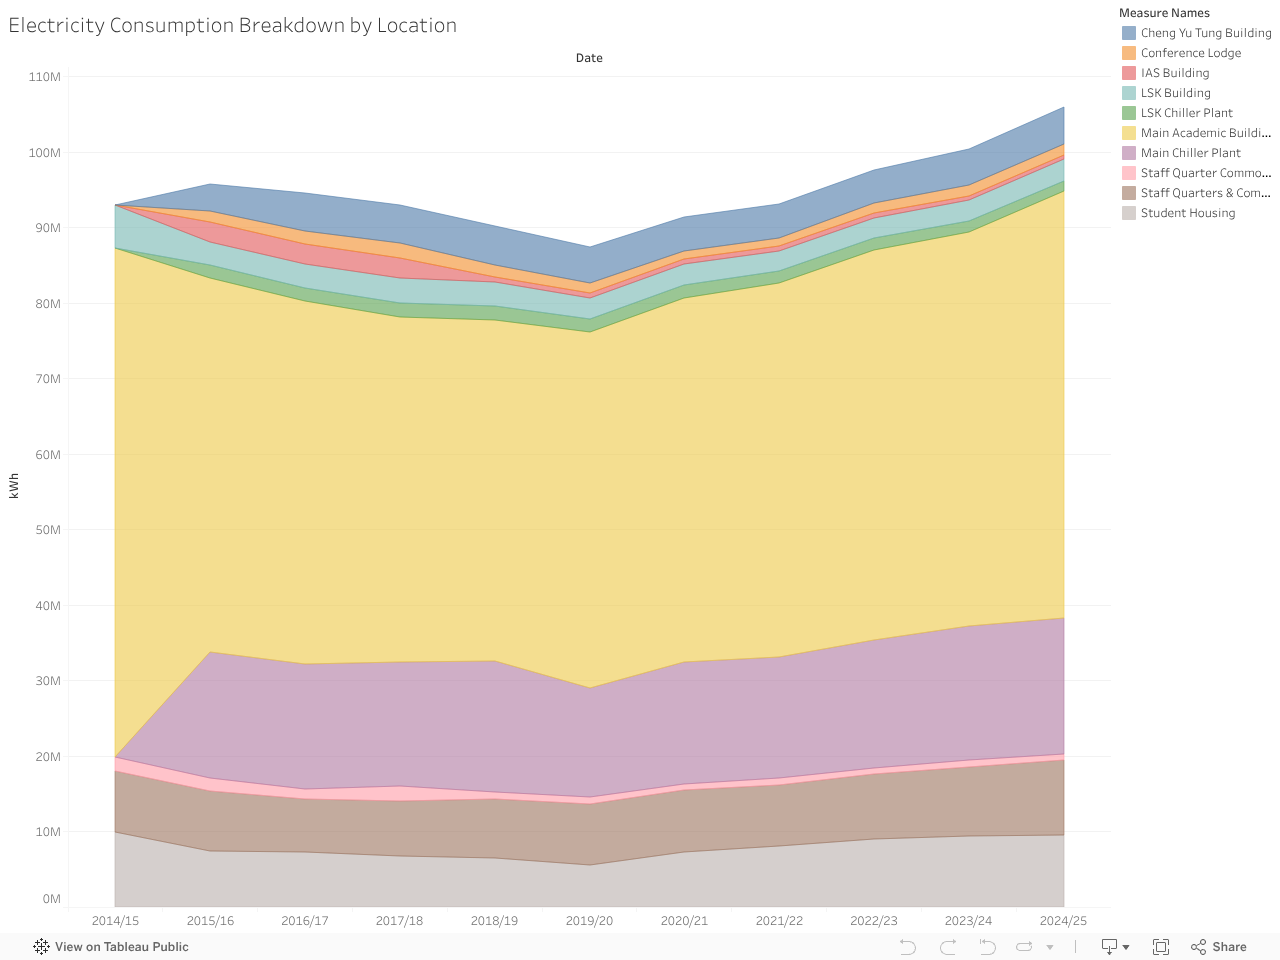
From the location breakdown of the campus electricity consumption, it is observed that the main academic building is the main consumer by taking up 54% of the total consumption, followed by the main chiller (17%), staff quarters and commercial outlets (9%), and student housing (7%).
The Solar PV Systems were installed on roof of buildings in HKUST, and the project was completed in 2023. The total rated Solar Power was 2845kW with around 7479 pieces 2mx1m Solar PV Panels and the kWh generated per year was as below: This marks the system as one of the largest of its kind in Hong Kong.
Despite the rooftop space on campus has been fully occupied by solar panels, the University is activly searching for innovations that could enhance the efficiency of the panels and alternative spaces to install more panels.

