Why is it tricky to compare LCA results of different products?
What does the graph show?
Example 1: Both Figure 1 and 2 show the relative contributions (in %) of various life cycle stages to a particular environmental issue in the production of cotton T-shirts.
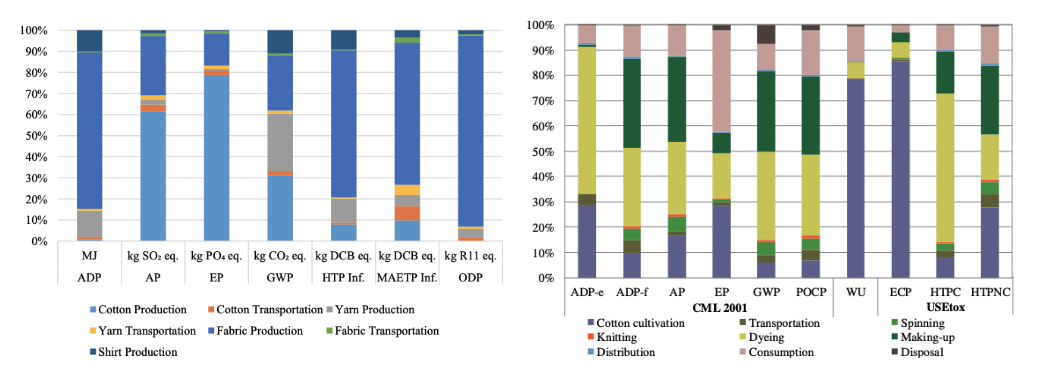
Figure 1(left) and 2(right) show relative contributions of cotton T-shirt production on impact categories
Focusing on the Global Warming Potential (GWP) impact category, the LCA results in Figure 1 suggests that the stage of ‘Cotton Production’ contributes close to 30% of GWP impact while the LCA results in Figure 2 suggests that the same stage of ‘Cotton Production or Cultivation’ contributes under 10% of GWP impact.
Of the following, which factor do you think can most explain the difference in findings?
-
One study was published in 2015 and another in 2020.
-
The functional unit of one study was ''250kg of cotton woven shirts'' (weighing 250g each) and another was ''one 100% cotton short-sleeved T-shirt'' (weighing 153g).
-
In the report, both studies described completing a cradle-to-grave analysis, but selected/different phases were included/excluded based on researcher’s design of the study
-
Manufacturers in Turkey provided values for the production phase in one study while field investigations in China yielded values for the production and use phases in the other study.
Sources
What does the graph show?
Example 2: Figures 3(left) and 4(right) show the Climate Change (CC) impact of producing a range of representative garments.
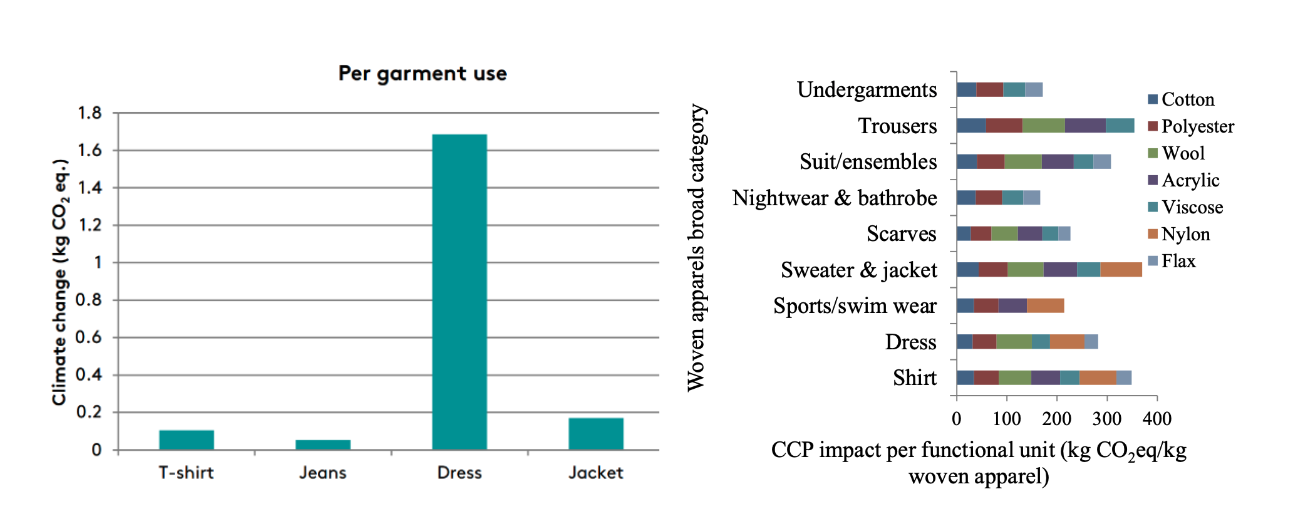
Consider the carbon footprint (kgCO2eq) calculated for producing (T-)shirts. Figure 3 suggests that around 2kg CO2eq is generated for one 100% cotton T-shirt (weighing 110g) while Figure 4 provides a value of 35kg CO2eq produced to yield one kg of cotton-woven shirt.
Why is there a disparity in the values?
-
The functional unit of one study was ''one use of the shirt'' and for the other study, it is ''the consumer use of one-kilogram apparel produced from different fibres''. With different functional units considered, the results are simply not comparable and highlights the issue of drawing any meaningful conclusions between two attributional LCA studies.
-
To calculate the carbon footprint, varied sources of data were used. For example:
-
(i) Production-phases figures referenced manufacturing data from different geographical locations in the databases
-
(ii) Use-phase consumption figures were based on the Sweden context for one study and the other was of the Australian population.
-
Sources
[1] http://mistrafuturefashion.com/output/lca-five-garments/
Comparing LCA findings is not that easy because there are further considerations:
Examine the functional unit used for each LCA study
-
products may seem similar but can be different in exact composition
-
a completely different functional unit is considered
Scrutinize scope (inclusions/exclusions of specific life cycle stages) used in the study
-
a direct comparison of the final LCA results is not always possible if certain processes are included/excluded
Consider production with different technologies or in different geographic regions (use of different assumptions or databases)
-
available inputs, production/transportation processes, sources of energy etc. can differ significantly in a different locale
-
updated databases will also lead to corresponding changes in results